Where is the cleanest air in the city?
According to the WHO, 9 out of 10 people on the planet breathe air whose pollution level exceeds safe norms. In cities this figure is almost always higher — but the difference between neighboring blocks can be twofold. You'll get a simple tool that reveals the ecological face of any district before you move there.

Why you need to think about this today
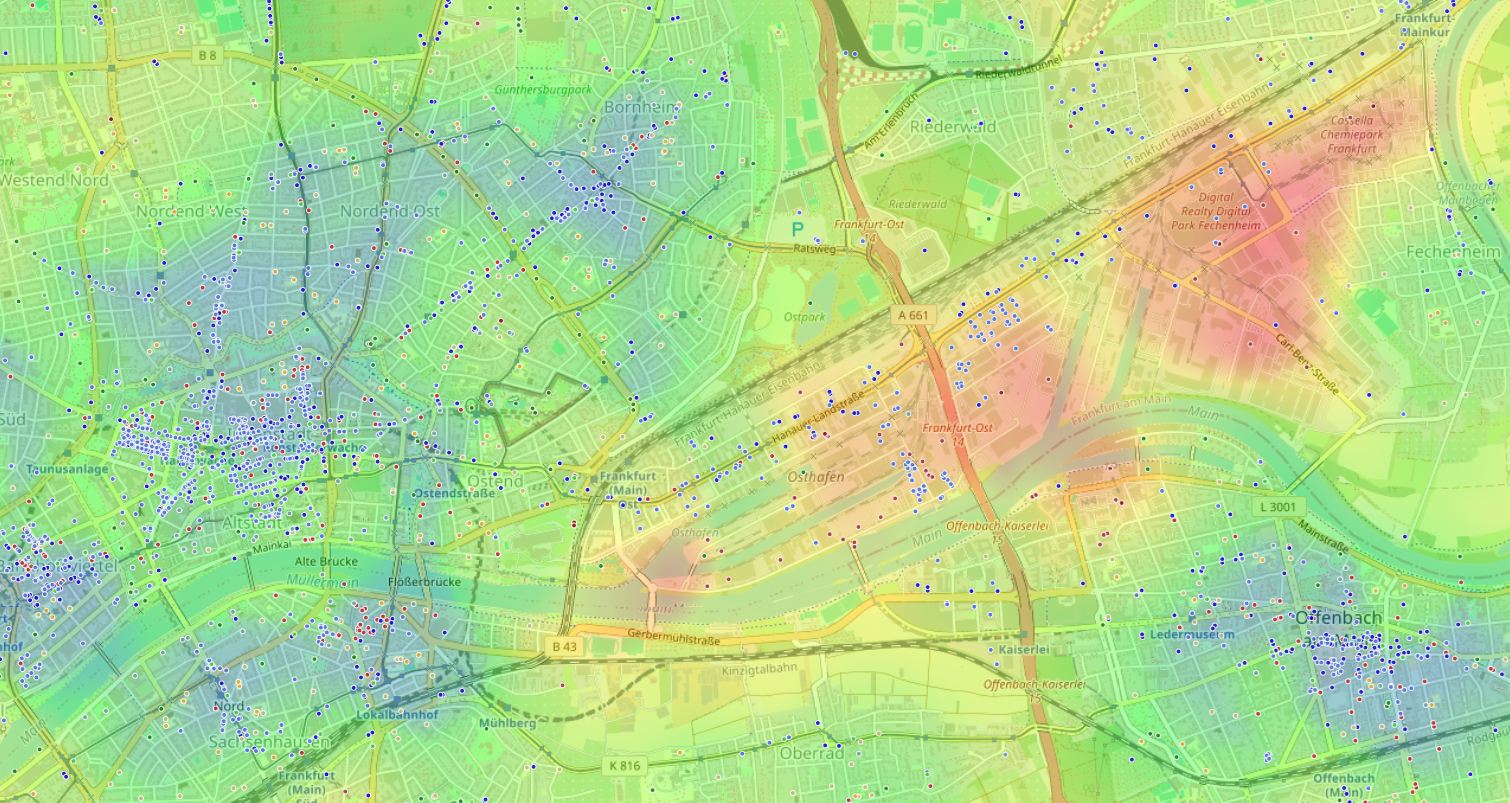
The morphology of the modern city changes faster than official ecological maps are updated. New parks appear, old industrial zones turn into residential quarters, and traffic flows are redistributed. Documents can't keep up with reality — but you can see it on a heat map.
The main pain point: you're choosing an apartment, office, or spot for walks with your child, but you only have averaged pollution data "by district." These numbers say nothing about a specific courtyard, how many minutes on foot to the nearest large park, or how much dust a highway 100 meters away brings.
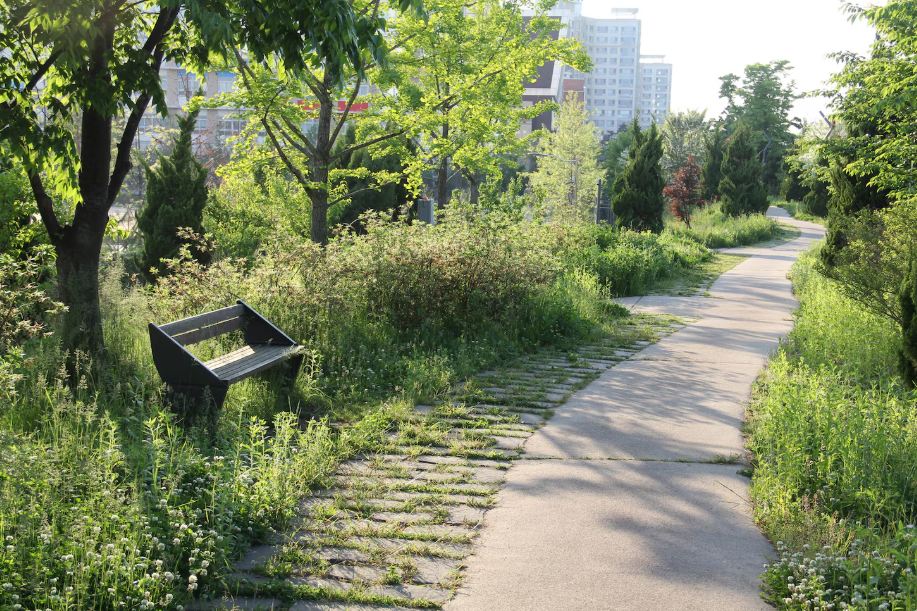
A block's microclimate isn't an abstraction. It's the sum of trees, car-free courtyards, distance from emission sources, and how easy it is to reach on foot.
What makes air better or worse at a point on the map
The invisible becomes visible when you overlay layers correctly
Air quality is shaped by two groups of factors: those that worsen it and those that restore it. Usually we see them separately: here's a square, here's a factory, here's a power plant. But a map assembled by hand won't show their combined effect on a specific point. A heat map solves this: all significant objects are weighted by a set "environmental balance." Positive balance for parks, sports areas, quiet courtyards. Negative — for industrial plants, dense highways, dusty production sites.
Dangerous neighbors
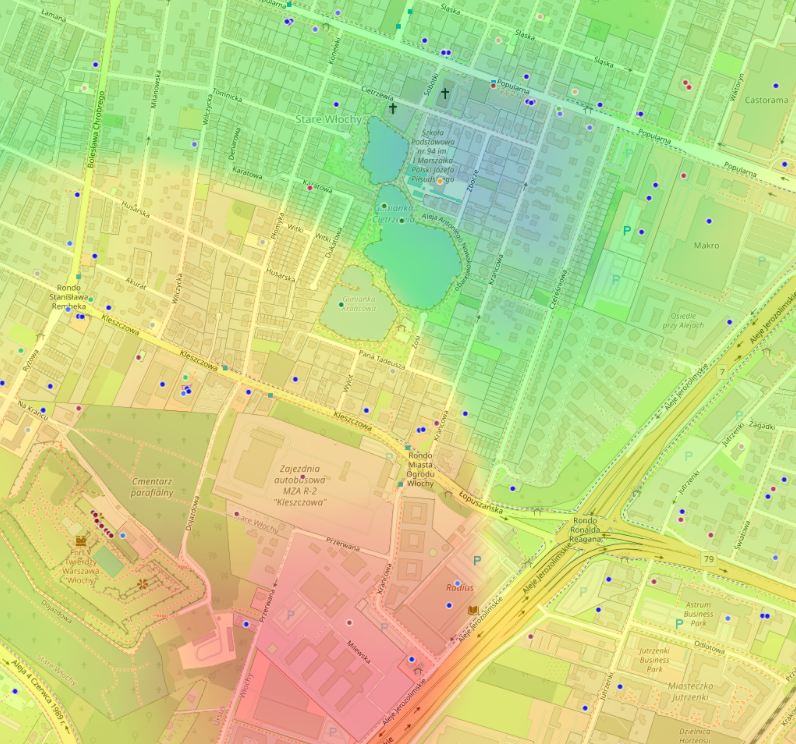
CATEGORY_Factory, CATEGORY_DirtFactory. Environmental balance from -5 to -10. Influence radius up to 800 m.
Green lungs
CATEGORY_Parks, CATEGORY_Sport. Environmental balance from +6 to +10. Influence radius up to 500 m.
Before
You look at an address and guess how clean it is. At best — you measure the distance to the nearest smokestack and the nearest park, manually.
After
One map immediately shows "red" and "green" zones, along with walkability to each object.
How to apply this
Pick a point on the map, configure categories (parks, squares — with positive weight; factories — with negative) and immediately see zones where the balance works most in your favor.
Air in the city isn't uniform — it changes from building to building. Assessing a district without spatial analysis is like choosing a car by average hospital temperature.
Practice: 4 steps to find your "green square"
Set your priorities
Decide what matters most for clean air: proximity to a large forest park, absence of harmful production nearby, or a balance of "lots of greenery — little traffic." This will affect how you configure the environmental balance.
Configure layers
Enable "ally" categories on the map: CATEGORY_Parks, CATEGORY_Landmarks, CATEGORY_Sport (they often mark green spaces). Then — "opposite" categories: CATEGORY_Factory, CATEGORY_DirtFactory. Set them to negative balance. The higher the absolute value, the more intense the heat spot.
Look at the gradient, not individual points
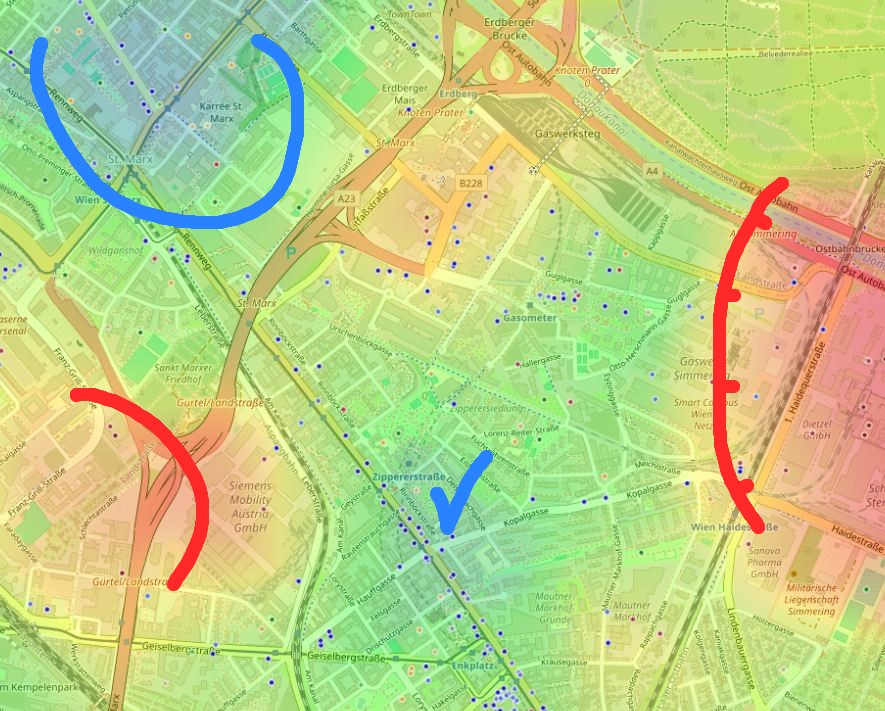
Cool blue and green areas show accumulated positive effect. Yellow and red — risk zones. Your goal is to find a fragment colored blue, even if it's surrounded by yellow blocks.
Check walkability
Living in a green zone isn't enough — you need to reach it quickly from your entrance on foot, without traffic lights and detours. Build a route from the point to the main park and check the estimated time. If it's more than 10 minutes — you'll rarely use the park.
Express diagnosis
Walking time to a green zone under 5 min.
Worth attention
5 to 12 minutes — worth checking for obstacles along the way.
Needs analysis
Over 12 minutes — the park is formally nearby but effectively far.
How to avoid manual data collection
The main barrier in this assessment is having to manually mark dozens of objects on the map and tune their influence radii. HotMap's geoinformation system takes on this work: it automatically finds all objects in selected categories, assigns expert-calibrated weights, and builds a heat map in seconds.
Try it on your own example: pick a district you're considering for life, enable "Quiet and calm" mode (it already accounts for greenery and distance from noise and dust sources) and see whether the map confirms or refutes your expectations.
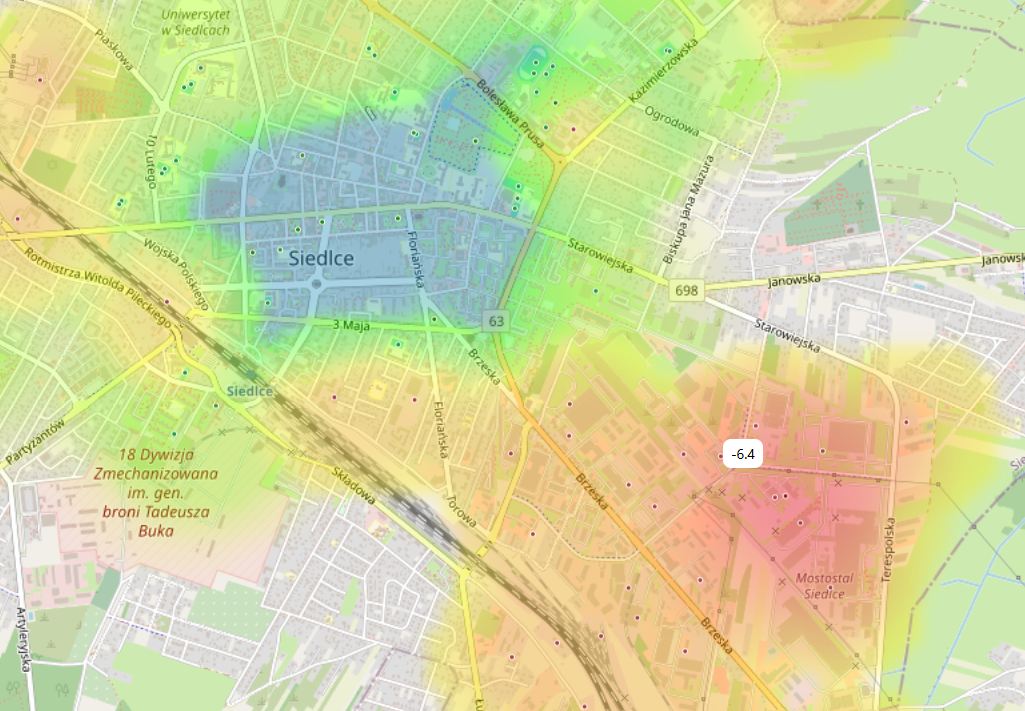
Summary: ecology at your fingertips
Air quality in the city isn't abstract "district ecology" but a precise, measurable characteristic of a specific point on the map. It comes from proximity to parks, distance to industrial zones, and the real time you're willing to spend getting to green islands. A heat map turns this data into a clear hint, helping you choose a place consciously — not by luck.
Start simple: look at your current address through positive and negative factors. That "clean air" may not be in another city but in the next block — you just didn't have a tool to see it before.
Frequently asked questions
Where does HotMap get object data?
The system uses open cartographic sources and regularly updated geodata. You always see the current location of parks, factories, sports facilities, and other categories.
Can you assess air at the site of a future building that isn't on the map yet?
Yes. You place a point where needed and analyze the surroundings — distances to existing objects, heat shade. The only thing the map won't account for is the impact of construction itself for the next couple of years until it's complete.
How does "Quiet and calm" mode differ from manual setup for finding clean air?
In "Quiet and calm" mode, weights and radii are already set by experts, focused on living comfort: greenery, absence of industry and noise. You get a balanced picture without tuning every slider. Manual mode is for fine-tuning to your unique criteria.