How to Find a "Blue Ocean" in Your City: Geoanalytics for Small Business
Learn to find zones where demand is ripe but supply is missing. No guessing and no expensive realtor advice.

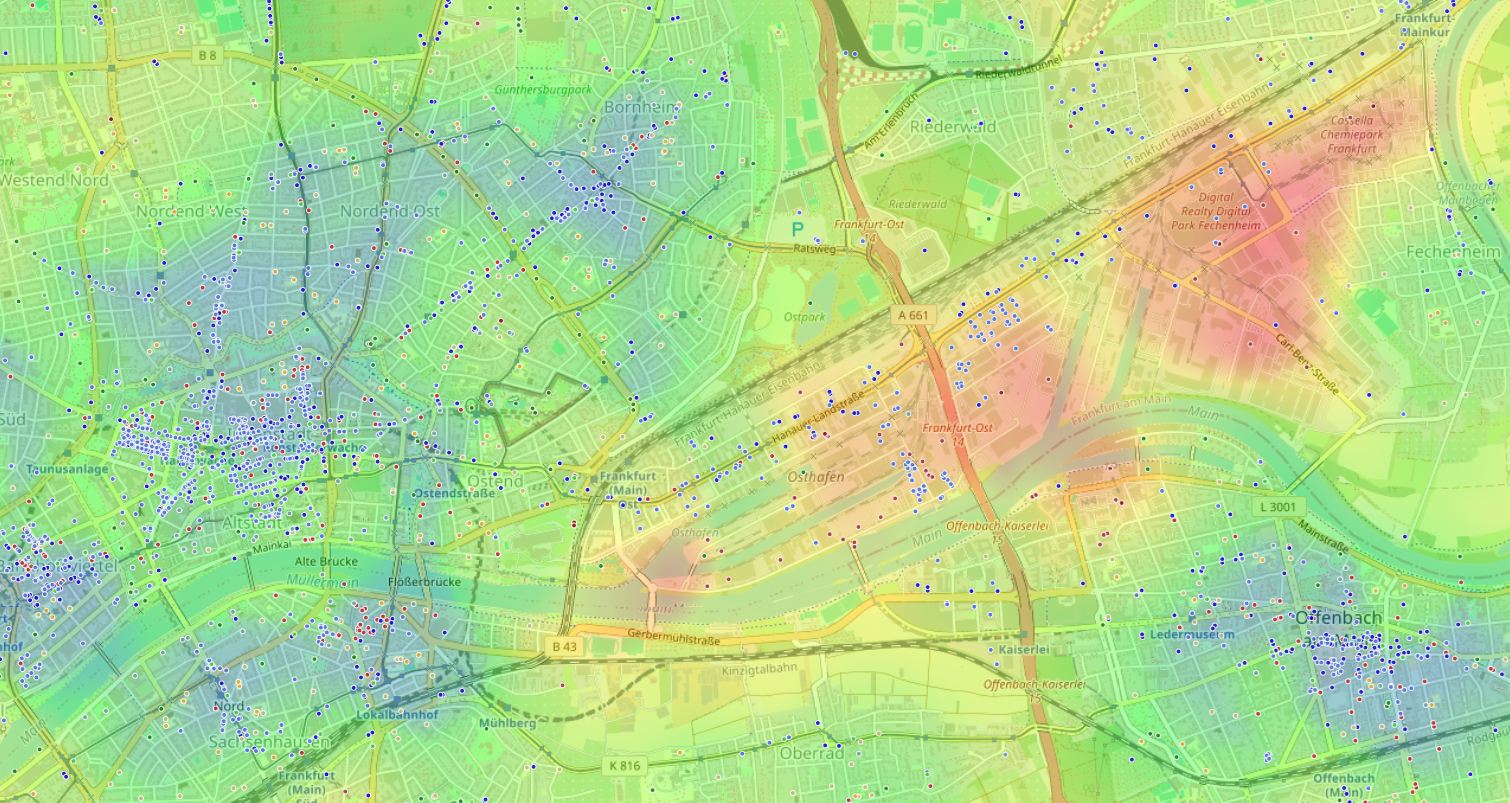
Why is there still no proper pharmacy in the "happiest" neighborhood?
Green courtyard, playgrounds, cafés, people strolling with strollers. Life is buzzing.
You have to drive to the next block for bread, and to the other end of the district for medicine.
This isn't random — it's an opportunity. You'll learn to find zones where demand is ripe but supply is missing. No guessing and no "expensive realtor advice."
Urbanism in the entrepreneur's service
Why this topic is urgent right now
The city is ceasing to be just a set of residential and business districts. People increasingly live within their micro-neighborhood: remote work, deliveries, local communities. Demand for the "15-minute city" is growing — where everything essential is within walking distance.
But businesses mostly open where traffic already exists — and enter fierce competition. The real gap stays unnoticed because it's invisible to the naked eye.

What exactly is the problem
A typical entrepreneur looks at the street: people walk — so the spot must be good. But that view confuses transit traffic with actual residence, ignores how much time residents are willing to spend traveling, and doesn't distinguish neighborhoods people leave from those they want to move to.
Ignore these factors and you may open in a "busy" place only to find customers walk past because they live elsewhere and only come here for work.
«The time we spend moving is a direct reflection of how space is designed. Where people are forced to spend half an hour on a simple purchase, enormous social tension builds — and unmet demand.»
If residents spend 40 minutes a week just getting to a pharmacy, they'll gladly switch to one 10 minutes from home. A time deficit is a precise marker of future loyalty.
Three keys to finding the ideal location
Happiness doesn't live where the storefronts are
Conventional wisdom says "busy place = good place." But overlay not just pedestrians but environmental balance — parks, schools, daycares, sports facilities, absence of harmful industry — and the most desirable neighborhoods for living aren't the most "commercial." They have low tenant turnover, stable families, and high demand for everyday services.
Meanwhile many entrepreneurs avoid such areas, calling them "bedroom communities." Thus the paradox: people live in an ideal place but drive to a neighboring retail hub for shopping.
How to check this on a map
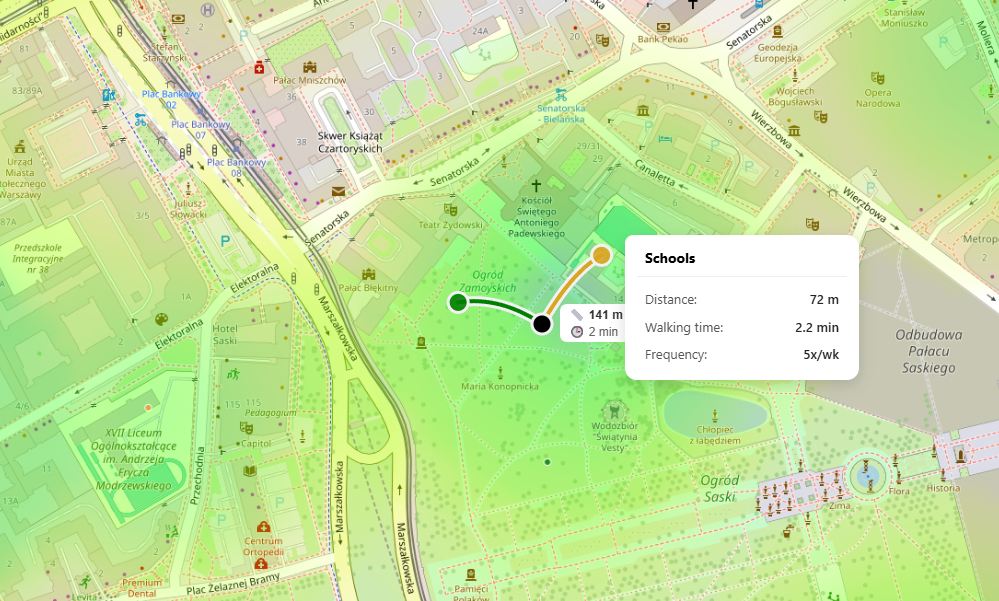
Open any tool that shows a "comfort" heat map (housing, greenery, social infrastructure). Turn off retail markers. Zones that stay bright green are candidates for discovering unmet demand. If there's no pharmacy, bakery, or pet store within 500 meters in such a patch — you've found a potential "blue ocean."
The "pass-through courtyard" myth
Many think: "Hundreds of people walk here every day — I'll open up and they're my customers." But if those hundreds are office workers rushing to the subway, they won't be your customers on Sunday morning.
Real customer potential isn't determined by street traffic but by walking time from residential buildings with high positive balance. People will detour 5–7 minutes for bread or medicine, but not 15.
Practical takeaway
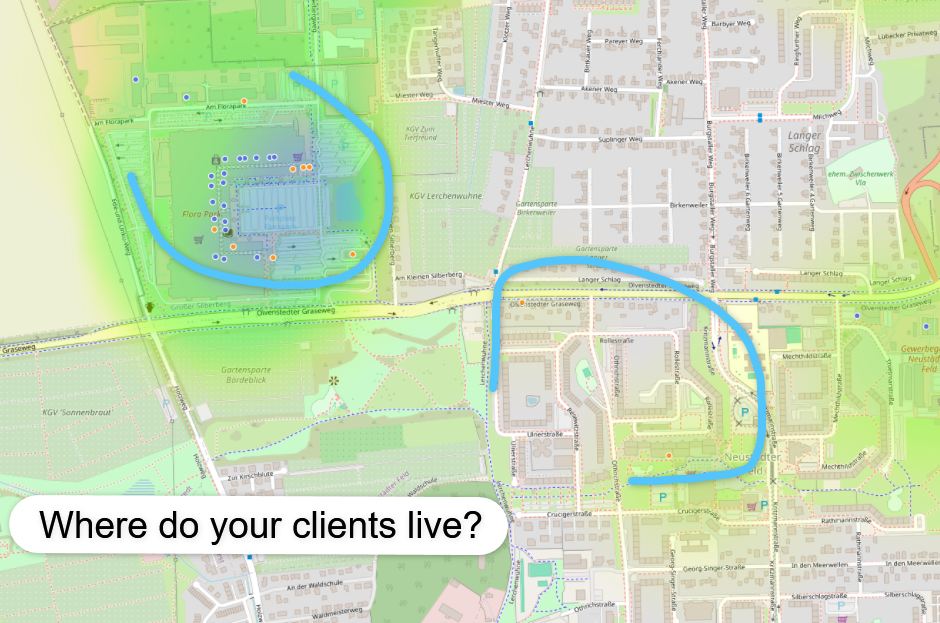
When analyzing a spot, look not at footfall but at apartment count within a 7-minute walking isochrone. If 2,000 families with children live in that zone — a children's development center will be busy from month one even if the place looks quiet.
From intuition to cold calculation
State without a tool
The entrepreneur picks a space by rent price and "visibility from the road." Assessment: "I think the neighborhood is okay." Result: unpredictable payback, often — quarterly revenue failure.
State with geoanalytics
Layers of positive factors (schools, parks, daytime activity) and existing supply are overlaid on the map. "Blue oceans" highlight automatically — then verify a specific address for time residents currently spend getting the service.
How to make the transition: form a query — "I want to see neighborhoods where quality-of-life index is high but the nearest pharmacy is farther than 600 meters." The system builds a deficit heat map. Next — walking accessibility from residential clusters. 15 minutes versus 40 — a difference that converts to revenue.
Your location search algorithm
Five steps to find a spot customers will come to on their own
Gather environmental balance data
Overlay categories that form a "happy" neighborhood: daycares, parks, sports facilities. Turn off all commercial for now. Find dense green zones — places where people actually want to live. Common mistake: stopping at large parks without residential development around them.
Subtract existing business in your category
Enable competitor or similar-service points. In green zones, "holes" appear immediately — areas with positive balance but no service. Note: look for absence within 500 meters, not "few."
Assess walking accessibility from housing
Pick a potential address and build a 7-minute walking isochrone. How many entrances fall inside? If it's at least 10 apartment blocks — the audience is already there.
Calculate customers' current time costs
Check how long residents spend on the equivalent service today. If they walk 25 minutes one way to a distant pharmacy, they're yours before you even open. The tool will show total time losses under the current setup.
Decide by deficit, not rent price
Compare several "empty" zones. Where residential density inside the isochrone is higher and alternatives are fewest — that's the golden spot.
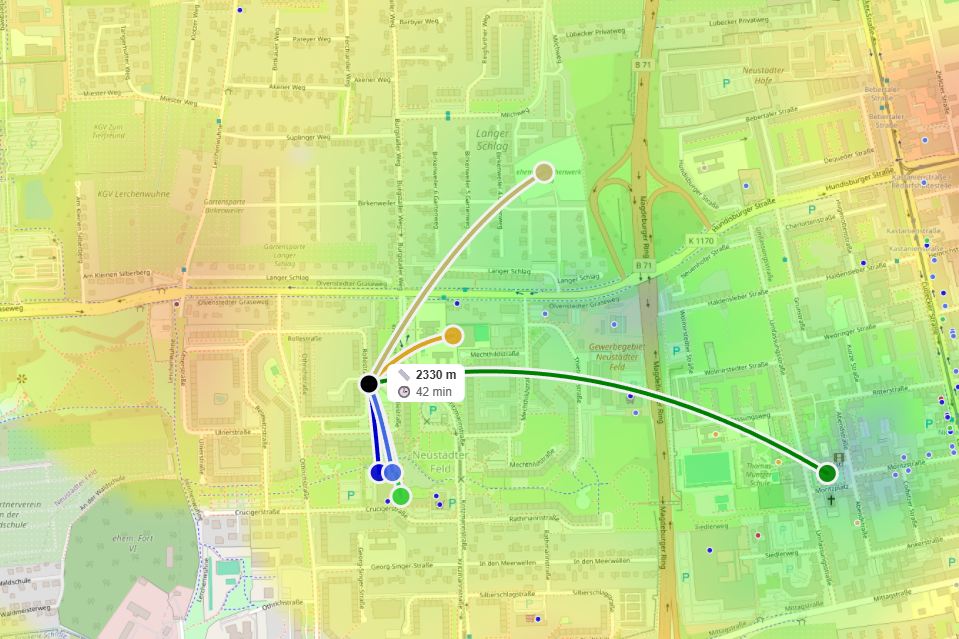
Tool for determining environmental balance and walking accessibility
What if geoanalytics were at your fingertips?
Everything above can be done manually: open several maps, find object directories, use a ruler for distance measurements, and calculate for hours.
But if you want to see a neighborhood wellbeing heat map and automatic time isochrone calculation without routine — check out HotMap. It overlays positive environmental balance across dozens of categories, highlights green "oases," and shows how large the time gap is between what residents have now and what you can offer.
This isn't a "where to catch the trend" tip but a tool for cold analysis: you choose a niche, and the map says where it's needed most.
A city without intuition
We're used to trusting feet and eyes: where it's noisy, it's profitable. But the city is nonlinear — and the places where people would actually want a bakery, veterinary clinic, or good bookstore are often hidden from a surface glance.
Geoanalytics doesn't cancel entrepreneurial instinct but gives it precise coordinates. Start by seeing your neighborhood not as streets and storefronts but as layers of needs overlaid on a map of time.
FAQ
How do you tell a temporary spike from sustained deficit?
Check the structure of positive factors. If the green zone rests on a park and one school, it may "migrate" as trends shift. But if there are several daycares, a sports complex, and low residential tenant turnover — the deficit is stable.
What if the found zone has very low foot traffic?
Look at car accessibility and parking. You may have found a niche for a "magnet" — a place people will drive to for a unique product. A quiet spot with good parking is ideal for a veterinary clinic or stretch studio.