What your apartment price is really made of
In 2017 in Moscow, two identical apartments in the same district sold for a difference of 4.2 million rubles. Square footage — identical. Layout — a copy. Condition — comparable. The only difference — 180 meters: that's how far one was from the metro entrance; the other stood right at the vestibule. This isn't market magic or coincidence — it's hedonic pricing in action.

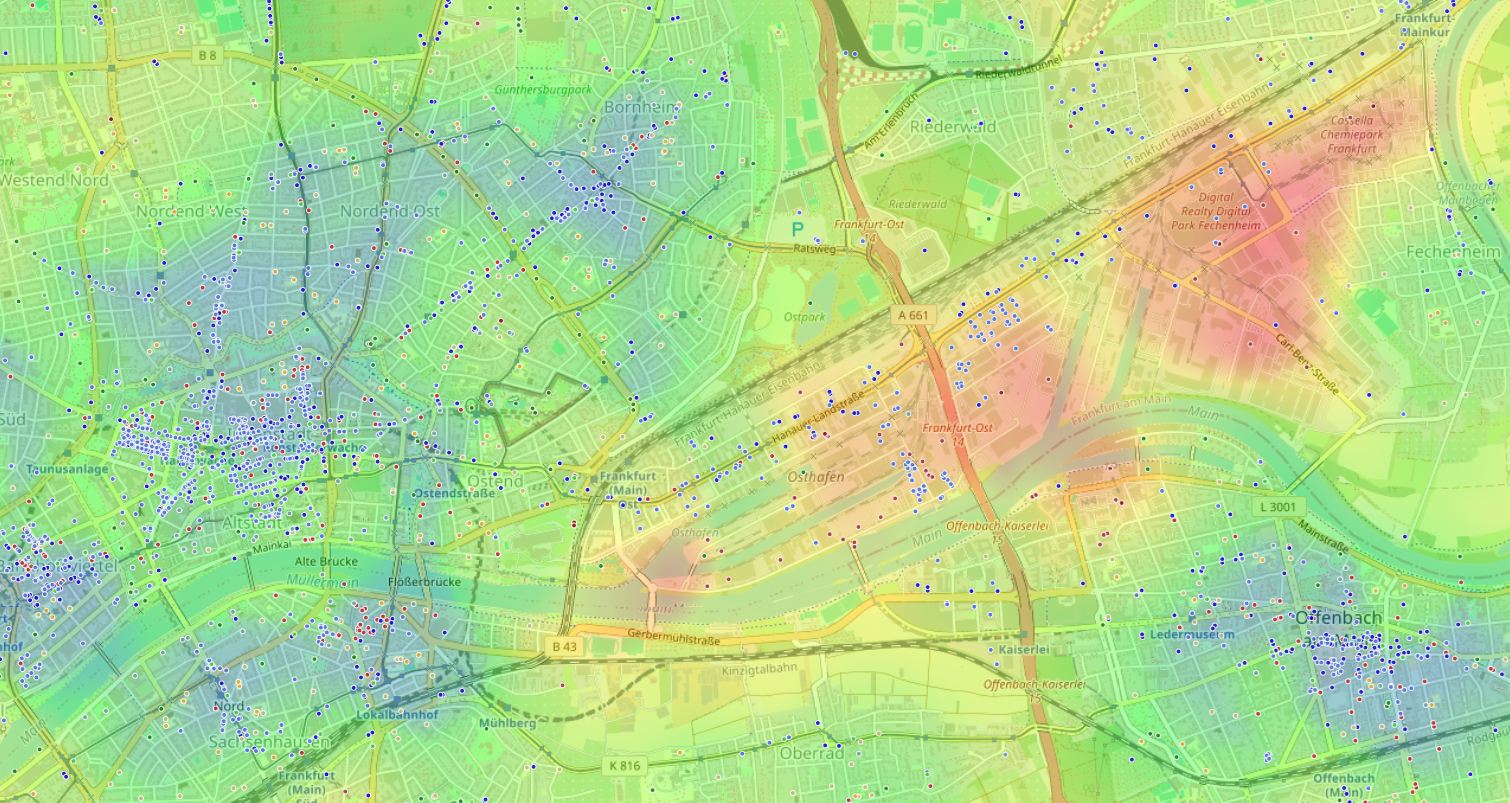
Let's unpack what's hidden behind the figure in the listing and how to understand the real cost per square meter.

"We shape cities, and then cities shape us"
How we learned to break price down to the molecule
Thirty years ago appraisers worked simply: they took comparables, matched square footage, and adjusted by eye. That approach didn't explain why an apartment by a park costs more and one by a busy highway costs less — even when the buildings share the same design.
Everything changed when the hedonic pricing method entered appraisal practice. The idea is simple: any good can be split into characteristics and each one's contribution to the final price can be calculated. With apartments this works especially clearly.
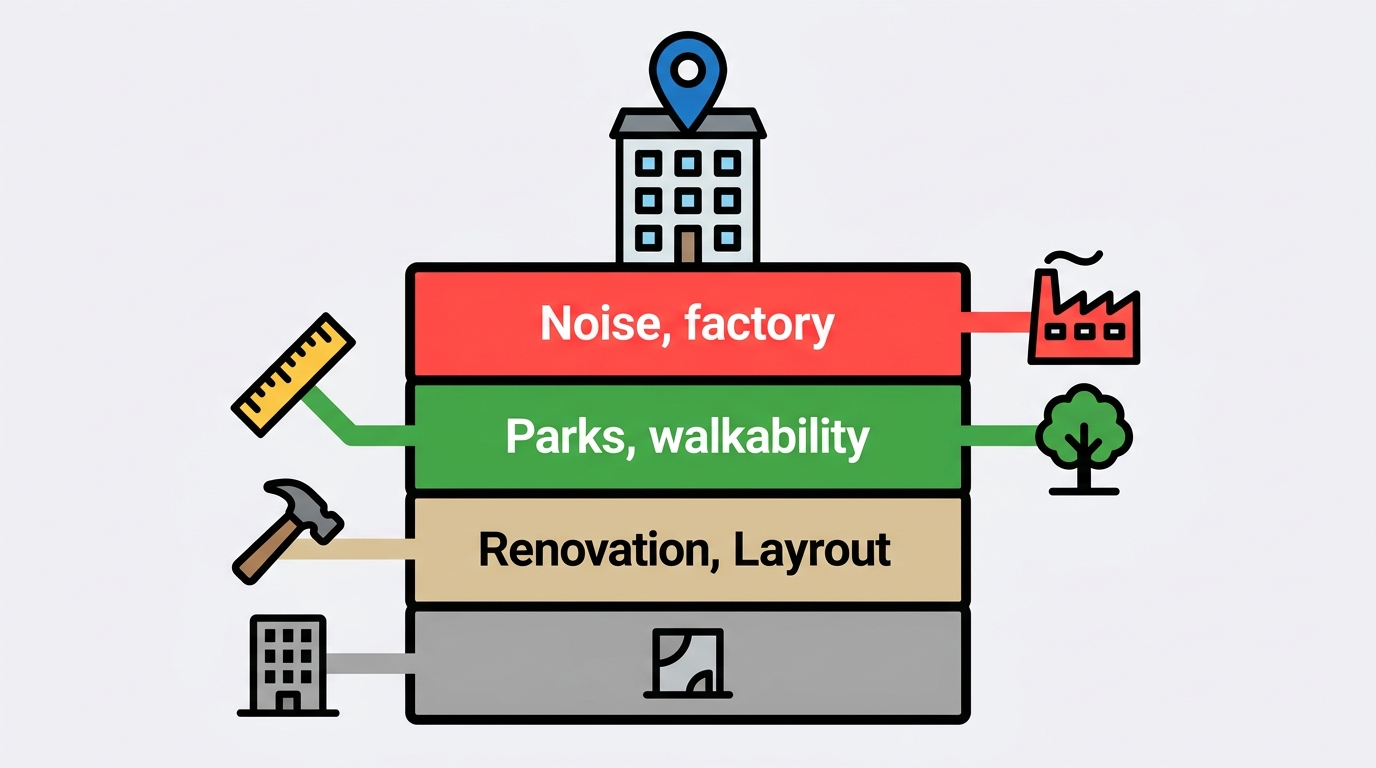
Structural characteristics
Floor, layout, kitchen size, ceiling height, wall material, year built. The base any appraisal starts from.
Locational factors
Distance to metro, proximity of parks, schools, clinics, shops. What makes the same apartment in different city points fundamentally different in value.
Environmental factors
Noise level, view characteristics, crime environment, neighborhood social composition. The most underrated direction of analysis.
The problem is the average buyer can assess only the first group. They checked the layout, floor, glanced at wall material — and think they've figured it out. Location and environment account for up to 60% of value. Ignoring them means overpaying blindly.
Myths and reality: three misconceptions about apartment price
Closer to center — always more expensive
Radial-concentric logic is ingrained. But open a heat map of real prices — you'll see patches. A prestigious bedroom district on the outskirts easily beats a depressed block three metro stops from the ring. Center comes in different kinds: ceremonial, tourist, and where people actually live. And sometimes a center you want to leave.
Metro is the only price driver
A metro station within walking distance adds roughly 8–12% to value. But if a flea market or industrial zone sits next to that station — the bonus is eaten entirely. The buyer gets transport access but loses environmental quality.
Noise and ecology are subjective
"I'll get used to it" is the most expensive phrase in real estate. The body doesn't adapt to noise pollution — it simply stops signaling stress. Three years later you sell at a discount without understanding why the price won't rise.
Noise and price per square meter
Correlation in one district
Noise level and price per square meter are directly linked — not a subjective impression but a measurable market factor.
What really shapes value: layer by layer
Layer one: time as currency
If every resident has a weekly time budget for travel, choosing an apartment is allocating that budget.
The average city dweller makes 12–15 mandatory trips per week: work, shops, daycare, pharmacy, gym. Multiply each by travel time — you get a weekly mobility budget.
The gap between an apartment with full infrastructure within walking distance and one where you drive for everything is 5–7 hours a week. That's 260–360 hours a year. Almost two weeks of life annually go just to the road. That's the difference the market capitalizes into price per square meter.
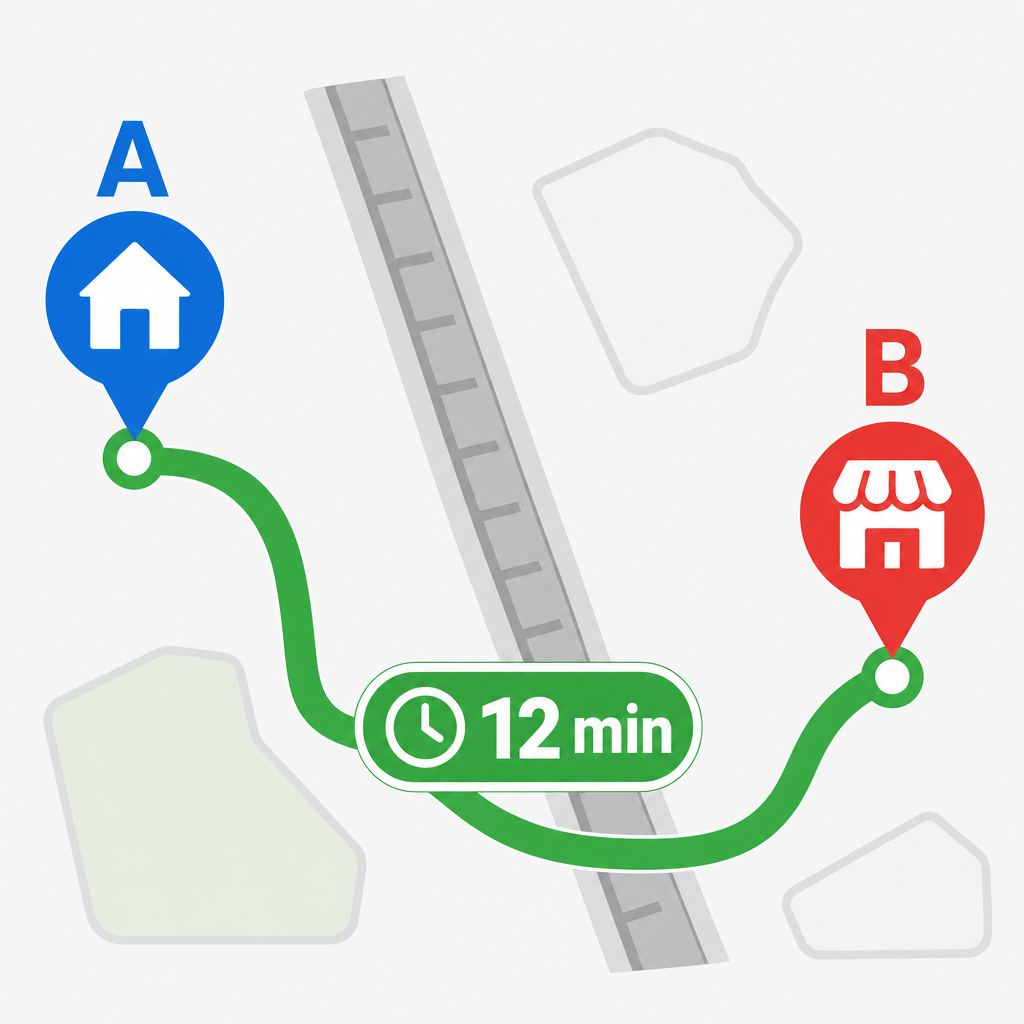
Weekly time budget for three location types
- "Bedroom district without infrastructure" — 14 hours
- "Mixed-use block" — 8 hours
- "Compact district with full services" — 5 hours
Layer two: walkability as privilege
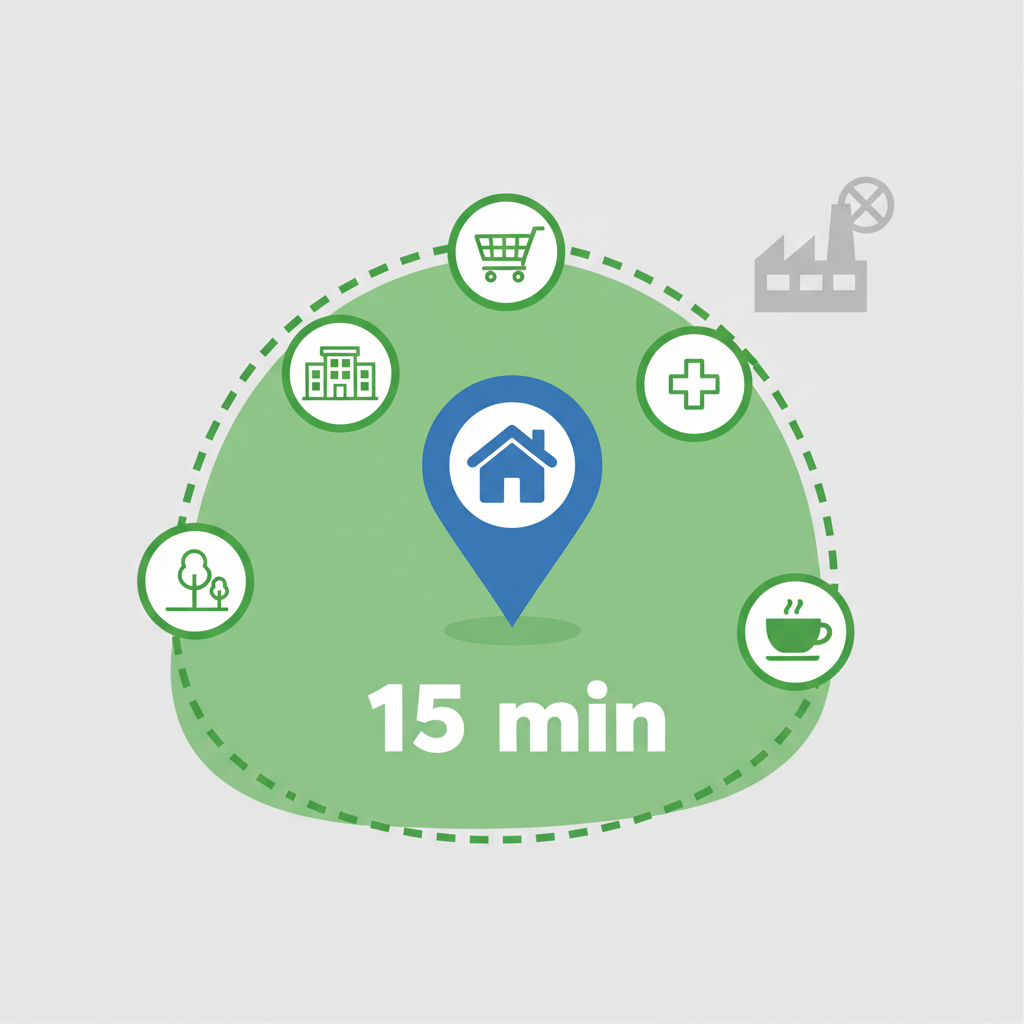
The 15-minute city isn't urbanist utopia but an economic model. When everything essential sits within a kilometer, you stop depending on traffic jams, transit schedules, and weather.
Apartments inside such an isochrone trade at a 15–25% premium vs. comparables outside it. But there's a nuance: balance matters, not just object count. Ten pharmacies and no park — bad balance. Three restaurants and an overcrowded school — also bad.
Objects with positive impact
- Parks and squares — up to +7% to value when within 200 meters
- Highly rated schools — up to +12%
- Cultural venues — +3–5%
- Sports infrastructure — +2–4%
Objects with negative impact
- Major highways — up to −15%
- Industrial zones — up to −20%
- Noisy entertainment clusters — up to −8%
- Informal markets and warehouses — up to −12%
Paradox: two apartments in the same building can have different price potential. Windows onto a courtyard with trees vs. windows onto a noisy street — different assets that look identical on paper.
Layer three: environmental balance
The hardest factor to assess and the most undervalued. It's not about a single park or metro but their combination.
Good balance
Nearby there's a school, park, grocery, pharmacy, transit stop — but no industrial zones, highways, or nightclubs. The area "lives" at different times: morning school runs, daytime moms with strollers, evening commuters returning home.
Bad balance
Five bars, one metro, and not a single tree. Or the opposite — quiet, but 20 minutes on foot to the nearest shop. Monofunctional environments always lose to mixed, balanced ones.
How to evaluate a location yourself: checklist
Before discussing apartment price, run a basic environmental audit. Here's what to do.
Build a 15-minute walking isochrone
From the apartment point, measure a kilometer in all directions. Everything inside that circle is your daily environment. Beyond it — "have to drive."
Count objects by category
Shops, pharmacies, schools, parks, transit, sports — plus. Industrial zones, highways, dumps, nightclubs — minus. The ratio matters.
Check the area at different times of day
Weekday morning, Friday evening, Sunday afternoon. Three slices show the real rhythm. What looks charming Saturday noon may be unbearable Monday at eight.
Estimate weekly time budget
Sketch your regular routes and add time. Compare with an alternative location. A 5-hour weekly gap is a serious argument, all else equal.

Jeff Speck in Walkable City cites research: increasing Walk Score by just 1 point correlates with a $700–3000 rise in housing value depending on the city. Walkability isn't an abstract good but a measurable financial asset.
When manual analysis hits a ceiling
The main barrier in self-assessment is data volume. Gathering a dozen categories, building isochrones, comparing several locations — that takes days. And purchase decisions often need to be fast.
We built HotMap for exactly this. You place a point on the map and instantly see environmental balance: what's within walking distance, how objects affect environmental quality, and how much time you'll spend traveling. The system highlights good and problem city zones — no expert, no long calculations, on one screen.
You still decide yourself. But now you see what was hidden behind listing figures.
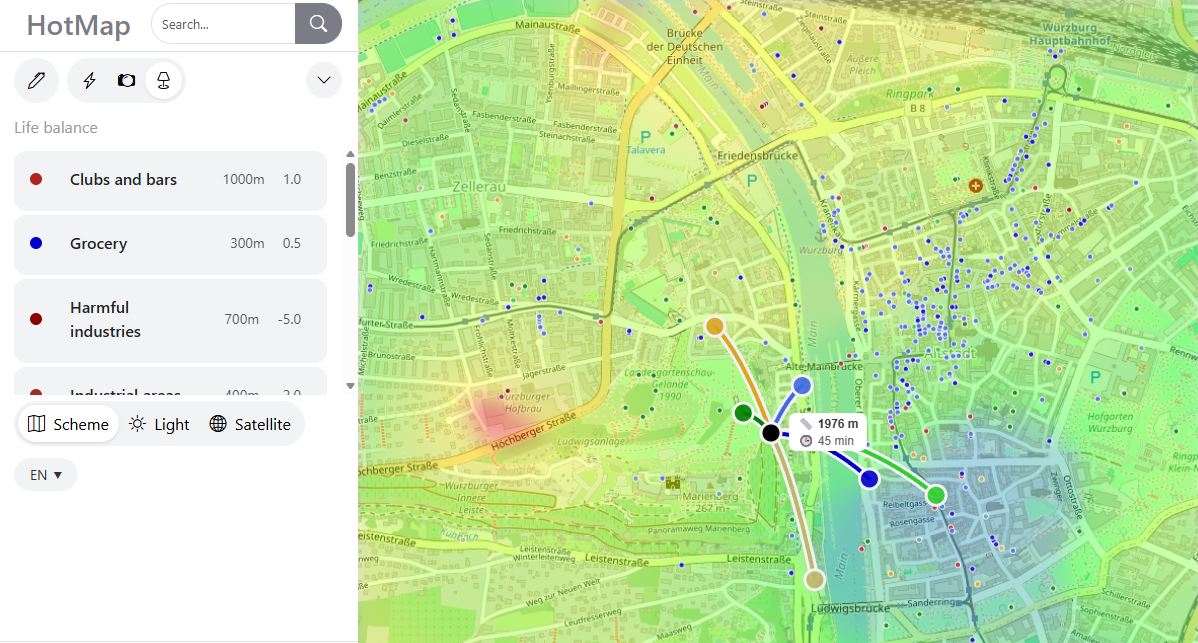
Apartment price is a snapshot of your future lifestyle
Choosing an apartment, you actually choose a scenario: how many hours per week on the road, where to walk with kids, how to get to work, whether a park for morning runs is nearby. The market long ago learned to translate these factors into rubles — now you need to learn to see them.
Start simple: next time you open a listing, look not at renovation or layout. Look at the map. Walk 15 minutes from that building. Ask yourself — are you ready to live in that radius for the next five years.
In brief: common questions
Why do apartments with the same square footage differ so much in price?
Because square footage is only a small part of price. Location, infrastructure, and environmental quality contribute most. Two identical apartments in different city points can differ 30–40% in cost from surroundings alone.
Can you predict how a district's price will change in 5 years?
You can estimate direction. If schools, parks, and transit open nearby — the district will appreciate. If warehouses, industrial zones, and highways are built — it will depreciate. HotMap helps track current balance and spot changes before they hit prices.
Is a metro station at the door always a plus?
Not always. If the station becomes a magnet for informal trade, traffic jams, and noise — the transport-access bonus is wiped out by environmental losses. Evaluate the whole picture, not one factor.