Neighbors in a gardening community: retirees, remote workers, or troublemakers? How surroundings reveal themselves on the map
Buying a plot outside the city is always a bit of a lottery. You seek peace and get round-the-clock parties. You dream of lively company and end up in a deserted settlement where not a single window is lit after nine in the evening. The paradox is that price per sotka and the look of the fence don't guarantee good neighbors. Below is a way to see the true face of any gardening community in 15 minutes without visiting in person. You'll learn how open data and the language of infrastructure reveal who your surroundings will be — and how to pick a plot without unpleasant surprises.

Why the "neighbor question" matters most right now
The explosive growth of remote work turned dachas from seasonal refuges into year-round homes. Families move outside the city but often find that infrastructure and social makeup of settlements were built for a "come for the weekend — leave" rhythm. Today gardening communities split into three very different worlds: "retiree," "young remote-worker," and chaotic ones where incompatible lifestyles mix. Ignoring this split is the main cause of downshifting disappointment — when millions invested bring no joy.
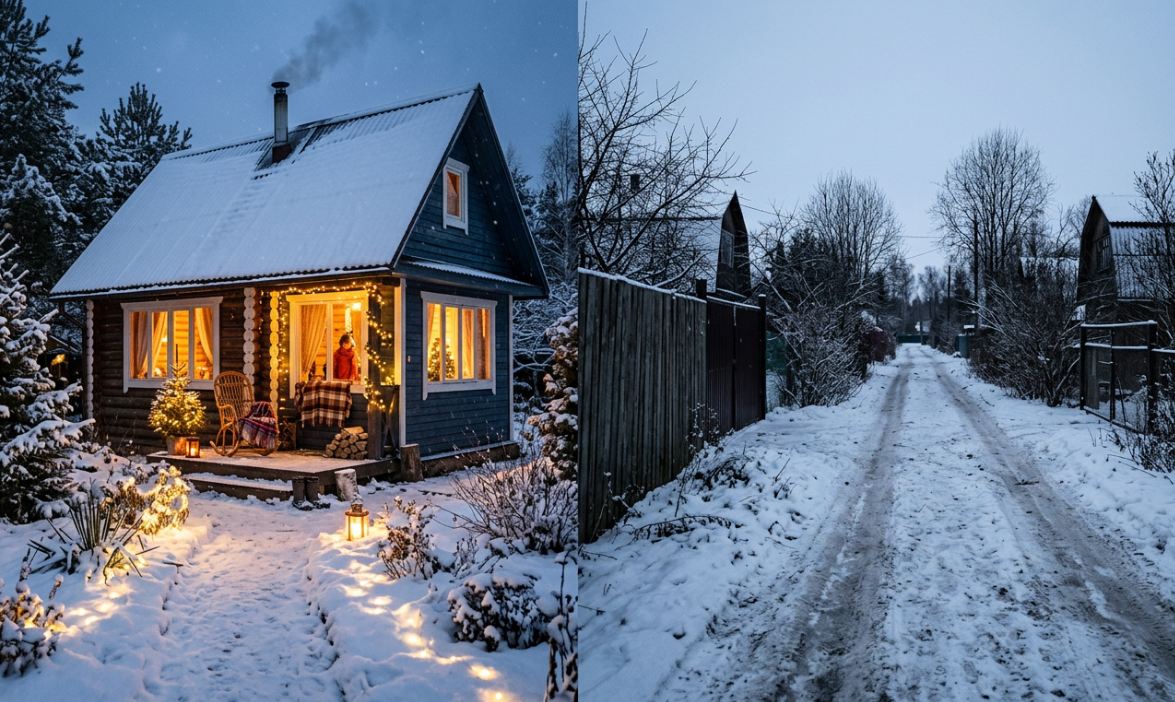
"We shape our homes, and then our homes shape us."
Environment dictates our behavior and social circle more strongly than personal plans. In a suburban settlement this formula works even harder. Walkable access to a shop, school, or — on the contrary — a 24/7 liquor store quietly reshapes who lives there over a few years. The map lets you read that scenario before you buy.
Three types of neighbors: how to spot them on the map
Retiree quiet: stable, but no room to maneuver
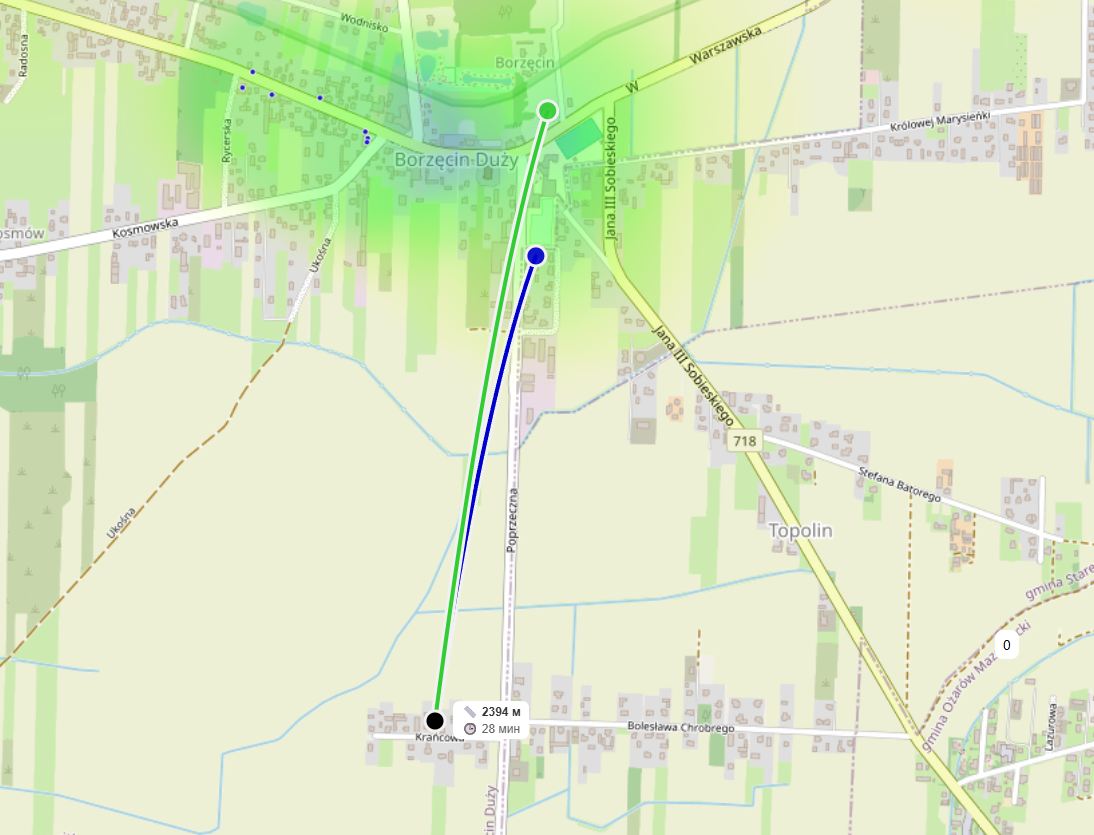
Many think that a lack of nearby amenities guarantees peace. In fact it's a marker of a "retiree gardening community" with an established, closed way of life. The map shows: within walking distance there's only a pharmacy and a small grocery — no cafés, children's clubs, or coworking spaces. For a family with kids, such "quiet" turns into daily car marathons to schools and activities. For a remote worker — isolation with no chance of real social life. A homogeneous older generation gradually turns the settlement into a zone where mobile coffee vans don't stop and delivery routes aren't laid. It's an ideal choice if your scenario is full calm and self-sufficiency — but for those who need dynamism, it becomes a trap.
Remote workers and families: green light on the heat map
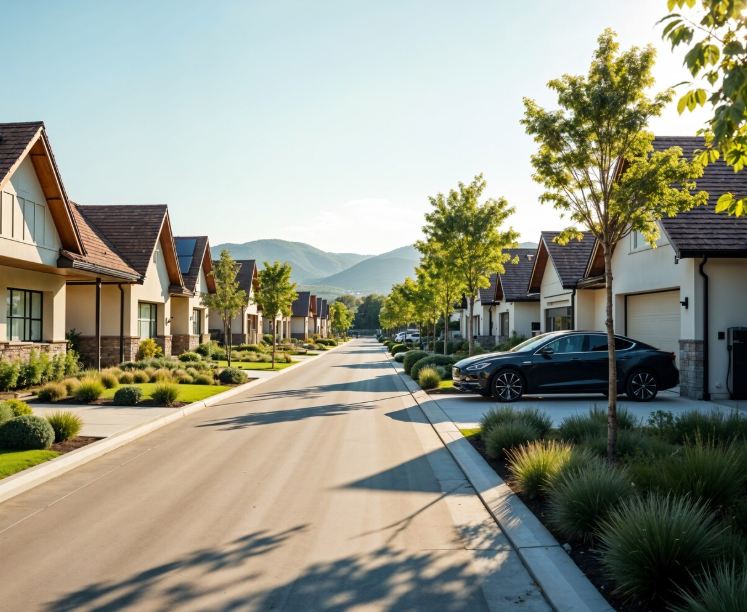
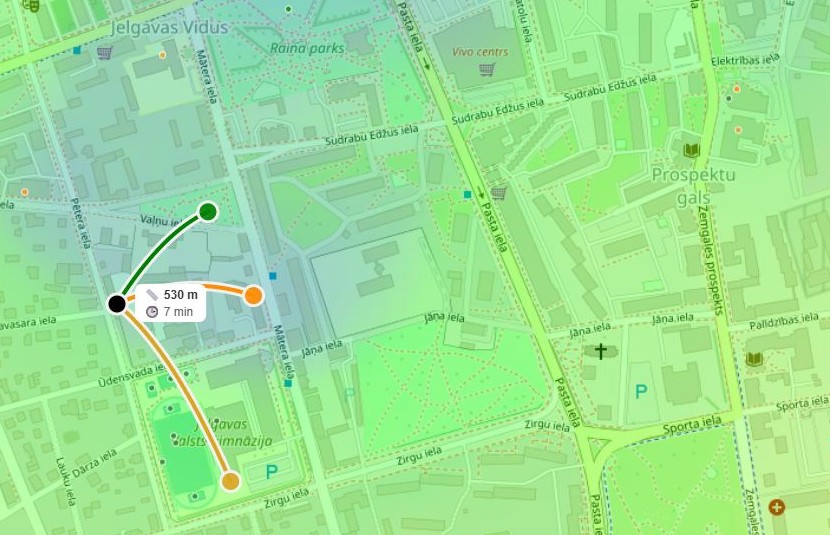
Balanced surroundings show on the heat map as a stable green patch. Signs of such a community: within a 10–15 minute walk there's a café with Wi-Fi, a school, a sports ground, and a park. Young families and remote employees settle here — working by day, strolling with strollers in the evening. The environment filters who moves in: parents value a safe route to school, freelancers — the option to swap home for a café. The map shows not just points but a daily-life scenario. Choosing a plot in such a zone, you invest not in walls but in convenient living and neighbors who share your rhythm.
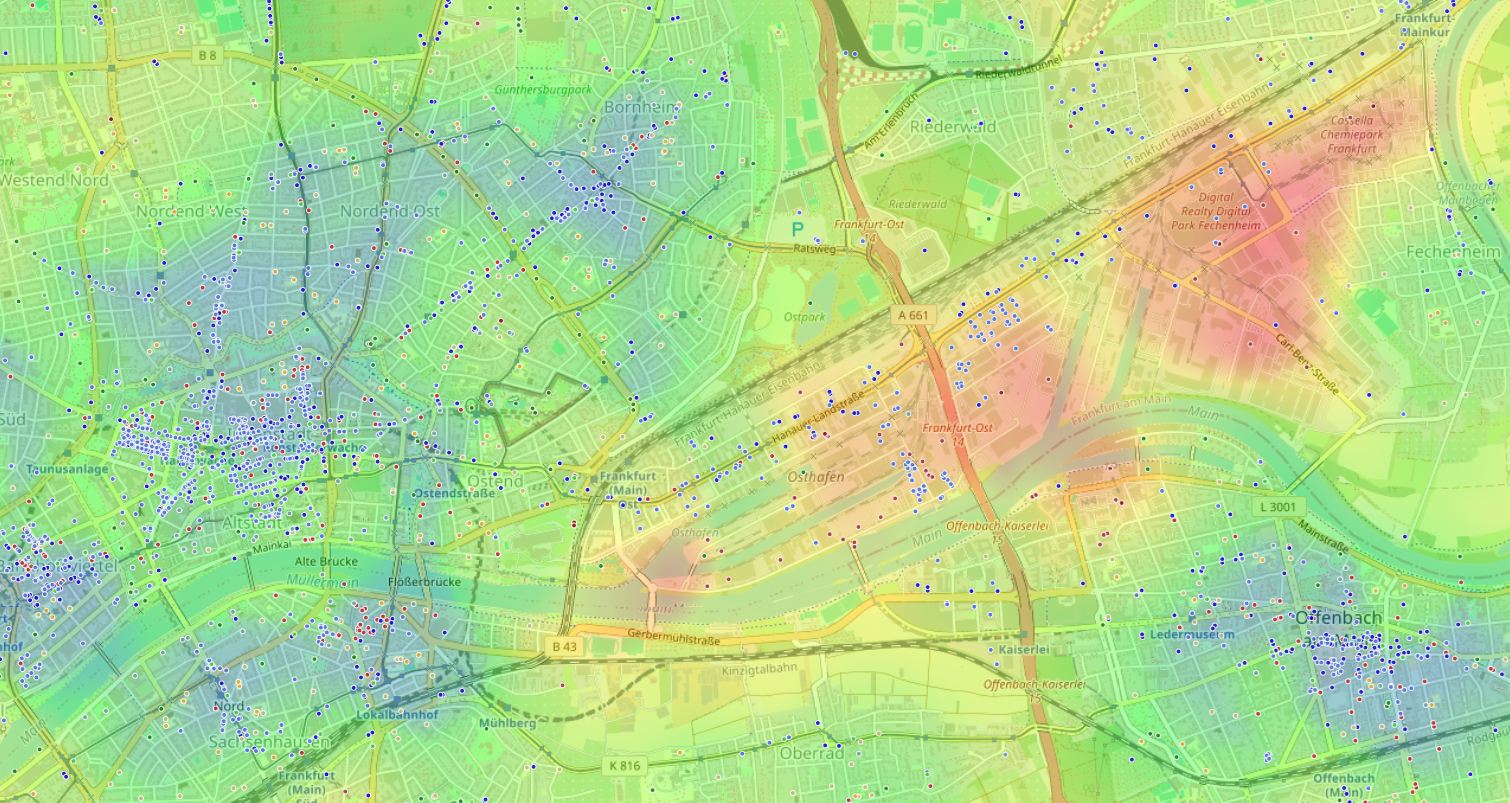
Marginal neighborhood: when the map screams red
Within a 10-minute walk. Noise, fights in the parking lot, a stream of strangers' cars on the community's only road.
A magnet for antisocial behavior and a gathering point for the local drunk crowd.
Unpleasant smell downwind, falling plot value, turnover of marginal tenants.
The reality: even an elite settlement can border a trouble spot if "red" infrastructure objects are nearby. A red zone on the heat map isn't a death sentence, but a direct sign of high risk. Ignoring it means hoping noisy neighbors won't appear. Practice shows: an outlet with cheap alcohol five minutes away almost guarantees a crowd that destroys the dacha idyll.
Noise complaints and distance to liquor store
Number of police reports
The data shows: the closer the liquor store, the more noise complaints. A direct link visible on the map.
Checklist: 15-minute environmental audit
Turn on map layers
Open the detailed map and enable "Shops," "Cafés," "Pharmacies," "Schools," "Leisure." Don't stop at the grocery store alone.
Assess walkability
Mark 15 minutes from the center of the plot. Count how many useful objects fall within that radius.
Mark minuses
Find hard-liquor sales points, 24/7 shops, nightclubs, and bars. Give each object a "-1."
Mark pluses
Find the nearest school, park, sports facility, good café. Assign "+1" and "+2" if the object is family-friendly.
Add up the score
A negative or zero sum means high risk. A steady plus means a plot in a healthy environment.
This quick audit already filters out 90% of problematic options. The hard part is manually going through dozens of categories and tallying the balance. At this stage many make a mistake by trusting the first impression from a pretty fence.
When manual analysis hits a wall of effort
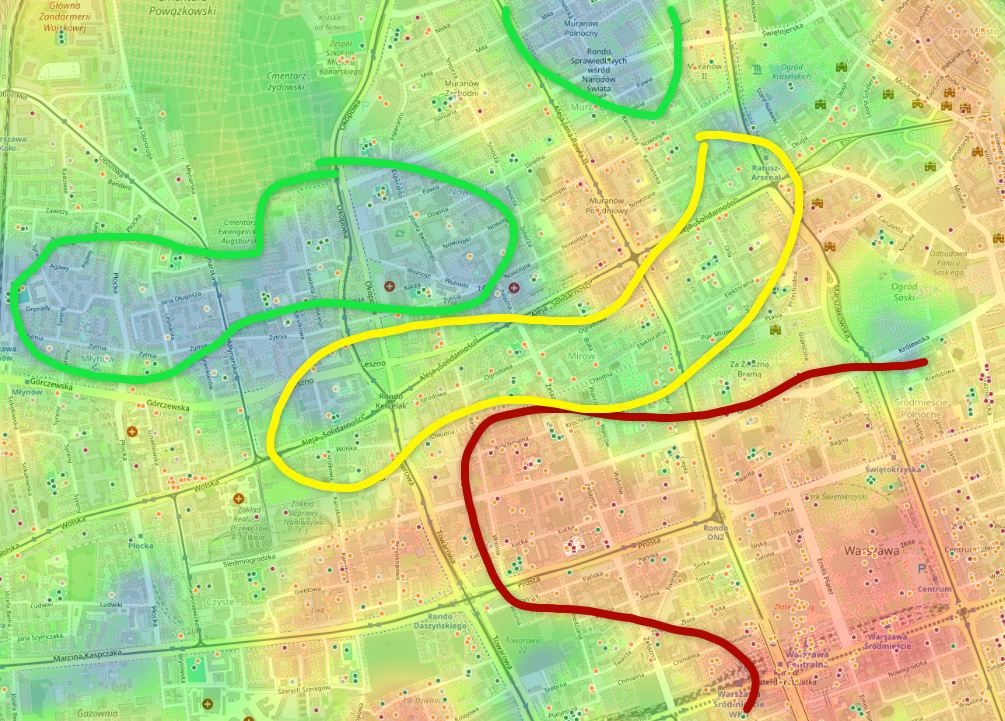
One of the main barriers in a DIY audit is weighting each object. What outweighs what: an excellent school 12 minutes away or a cheap diner 5 minutes away? HotMap was built to remove that uncertainty. The app automatically calculates environmental balance and turns dry map points into a clear heat scheme.
You simply choose "Quiet and calm" mode — and see which plots are truly quiet and which only pretend to be on weekday afternoons. Try this view on your own example — your familiar area may open up from an unexpected side.
The map isn't a fortune teller, but your main advisor
There's no perfect place. But there's an objective difference between a plot that poses as a quiet corner and one confirmed by dozens of positive infrastructure markers. The environmental balance heat map shows not an abstract rating but a concrete scenario of your future life: where you'll drink morning coffee, where children will play, where you'll commute from. It's an honest conversation with reality before signing the contract.
Start small: look at any three settlements through the language of the map. You'll quickly learn to tell "red flags" from promises of a calm life. And when you want precision without manual recalculation — just open HotMap and trust the layer that can't lie.
Frequently asked questions
Can I trust only the map without visiting in person?
The map filters out obviously problematic options and gives an objective baseline. But the final decision still belongs to your feet: visit on a weekday evening and on Saturday, listen to the quiet.
Does HotMap work only for suburban gardening communities?
The system was built to assess urban environments of any density. It highlights comfortable zones equally well in a megacity and in a gardening community — only the scale and set of meaningful categories change.
What if I already bought a plot and realized the surroundings don't match expectations?
The map helps decide next steps: whether to change location or compensate for environmental drawbacks on your own (talk to neighbors, initiate a playground). Worst of all is staying in a blind spot.